
I hate to admit it, but I’m a bit of a dork.
You see, I did really well in school, so I guess I could have been considered a dork back then. But I was also a really good athlete, so that made me “cooler” and so I never got a dork label.
But I did something many years ago that clearly classifies me as a dork. What did I do? I had one of my articles published in Quirk’s Market Research Review. Quirk’s is a trade journal for market research professionals that mostly talks about new market research techniques and ways to tabulate data. Pretty exciting stuff, I know 🙂
I think many of the other authors at Quirk’s are like the guys from Revenge of the Nerds, complete with pocket protectors. But, when I submitted my article, I didn’t care, because I had something important to share.
What I shared with Quirk’s readers (this was way back in 1994 so they don’t even have an archive of the article on their website), was what I call “The Improvement Matrix.” I originally created these matrices for bigger businesses who paid big bucks for them.
But over the years, I realized they could be created much less expensively, and have HUGE value to entrepreneurs like you.
So what is the “The Improvement Matrix?”
It’s simply a way of looking at your products and services and figuring out what you should improve and in what order.
Let me walk you through it. As an example, let’s assume that I’m Sal. Sal’s my landscaper. He frustrates me to no end since he’s such a bad marketer [in fact he makes me think about getting into the landscaping business since I know I’d clean up….but I’ll stop digressing].
OK. The first step is to identify what it is that your customers find most important.
So, as a landscaping customer, Sal should survey me and his other customers on the 8-12 attributes of his business that I find most important.
Maybe Sal would have chosen these attributes to survey:
1. Quality of lawn mowing
2. Quality of plant trimming
3. Offers to do additional work (e.g., clean leaves from gutters)
4. Price
5. Value (fairness of price based on quality of service)
6. Ease of billing
7. Ease of communications with company
8. Professionalism of workers
For each attribute, he should ask customers, “How important are these attributes to you in your landscaping company?”
He could have used a 4 point scale as follows:
1 – Not important
2 – Somewhat Important
3 – Very Important
4 – Extremely important
The results may have looked as follows:
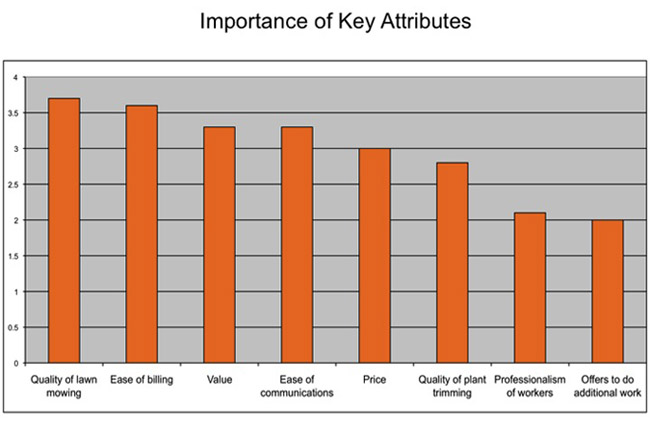
As you can see, Sal’s customers considered “quality of lawn mowing” and “ease of billing” to be the most important attributes. Conversely, the least important attributes were “professionalism of workers” and “offers to do additional work.”
The next question on Sal’s survey should have been: “How do you rate my performance on these attributes?”
He could have used a 4 point scale again as follows:
1 – Poor
2 – Fair
3 – Very Good
4 – Excellent
Importantly, Sal should judge responses to this performance question against how important the attributes are. The results may have looked as follows:
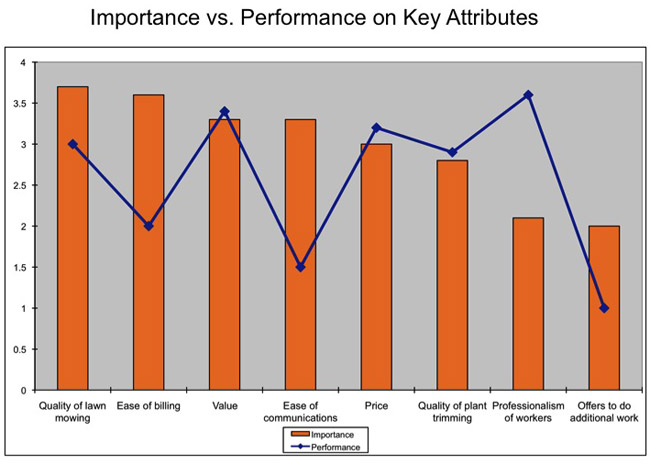
As you can see from the chart, on attributes like “value,” Sal’s performance is in line with importance. But, on the key attribute of “ease of billing,” Sal is vastly underperforming. And, on the non- or less-important attribute of “professionalism of workers” (maybe Sal has his workers dress in formal uniforms), he is over-performing.
So, what should Sal do? Well he should clearly focus on improving his “ease of billing” since this will improve customer satisfaction. Also, if he is investing too much money and time in “professionalism of workers,” he should consider re-allocating those resources to improving “ease of billing.”
As you can see, the beauty of the chart, based on simply 2 sets of questions asked to customers, is that it identifies the most important areas of your product or service to fix to better satisfy customers and gain competitive advantage.
Now, a final way to look at the performance chart is as a matrix, which I call the “Improvement Matrix.” You can see the matrix below.
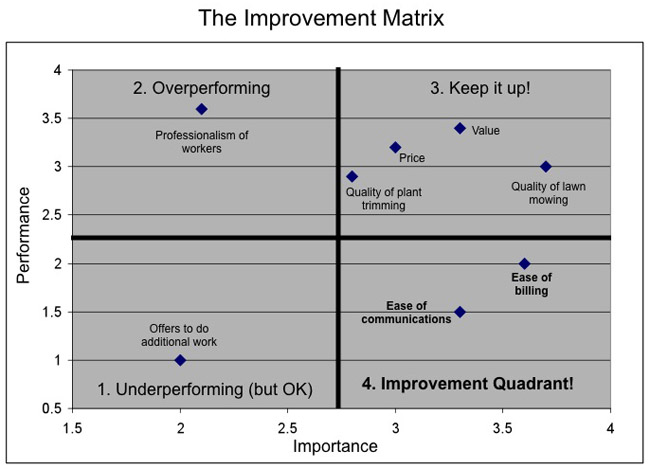
The Improvement Matrix is simply a different way of looking at importance vs. performance data. It plots the data and classifies each attribute into 4 quadrants:
1. Underperforming (but OK): you are underperforming in this area, but customers don’t care much about it, so that’s ok.
2. Overperforming: you are doing well in this area; but customers don’t value it. Keep doing what you’re doing, or consider allocating resources away from this area into a more important area.
3. Keep it up: these are areas that your customers care about and that you are doing well in. Keep it up.
4. Improvement Quadrant: this quadrant is the key. It shows those areas that customers find important, but for which your performance is not up to speed. You MUST get better in these areas ASAP.
As you can see, the Improvement Matrix will alert you to the key areas of your product and service that you must improve. All it requires is a simple customer survey and plotting of the data. And the results can revolutionize your business. So do it!
Suggested Resource: Would you like to know more ways to improve your business; and turn it into one worth $10 million or more? Then check out Growthink’s 8 Figure Formula below.
The Secret Formula to
Building a $10 Million Company
If you want to build a $10 million+ company, you must focus on building Value. And to build Value, you need to follow a specific formula.
On this page, I layout the precise formula for you.
As you scroll down the page, you’ll see the important schematic below:
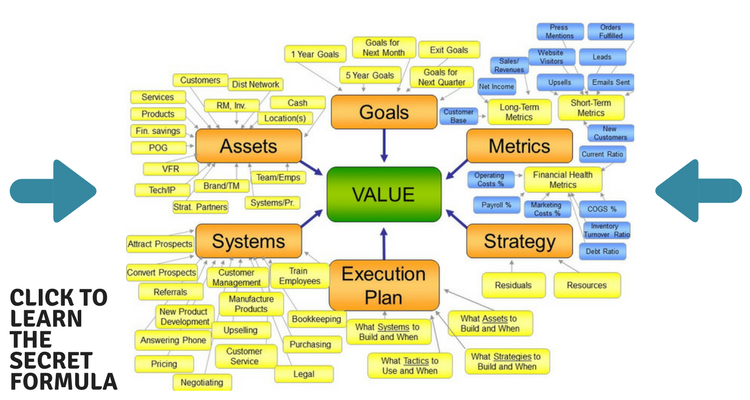
Don’t be overwhelmed by its complexity, by the time you see it, it’ll make perfect sense. And you’ll be able to follow it to dramatically grow your business.
Click here to learn how to grow a $10 million+ company today